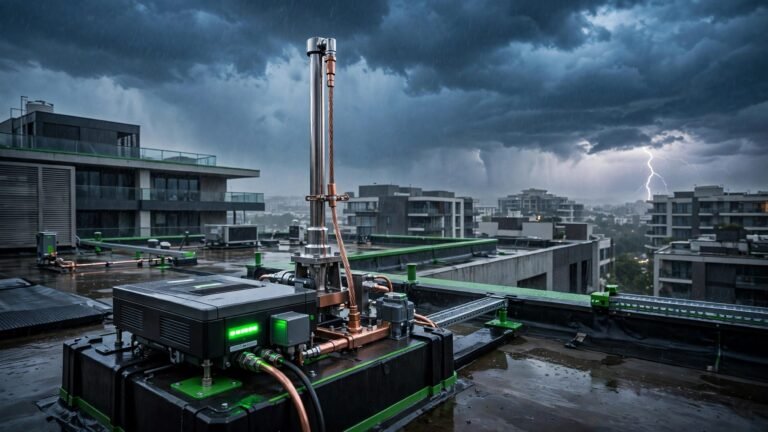
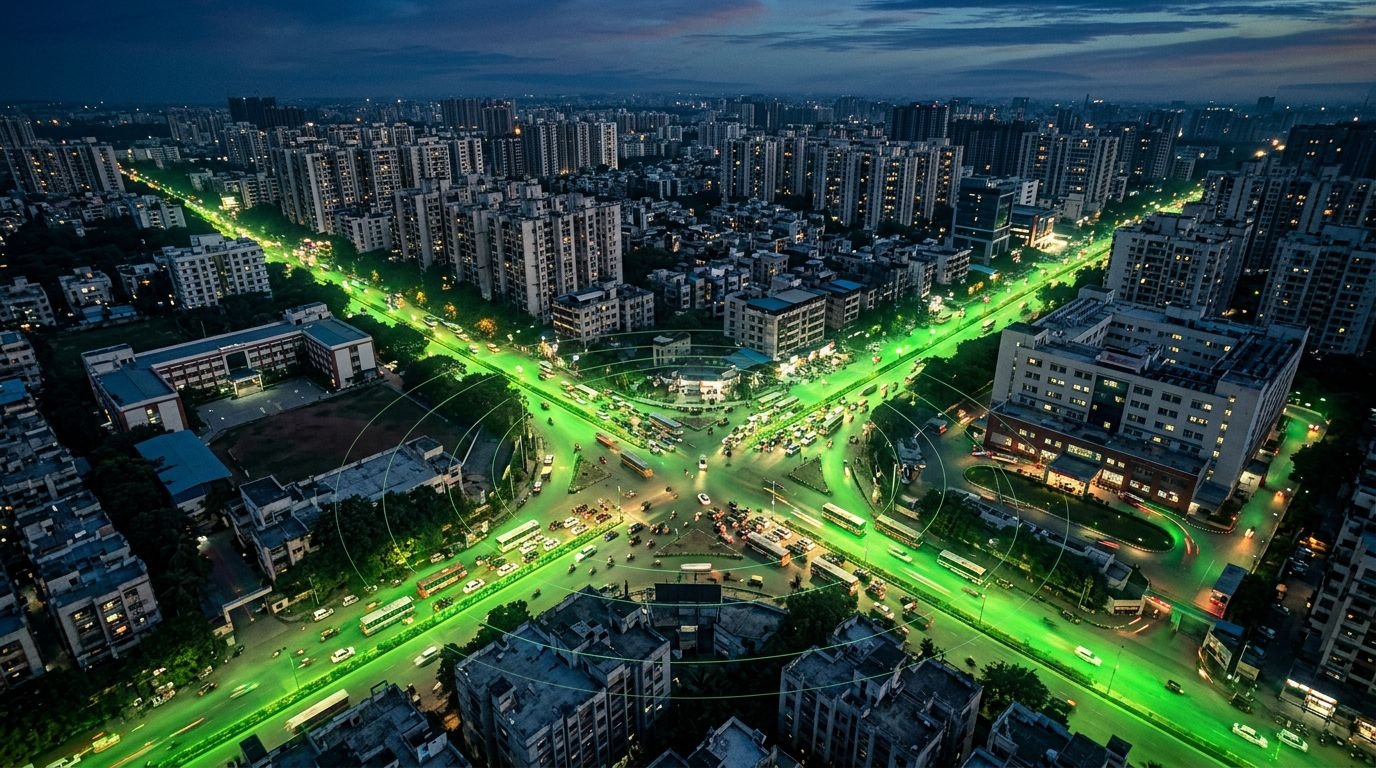
Why Indian Cities Need Noise Maps Before They Build More
 TBH Editorial
The loudest street isn’t always the one doing the most harm. A bedroom can be wrecked by a steady traffic hum that never turns into silence.
The noise maps India needs are not pretty colour bands for a planning presentation. They should guide urban planning decisions about roads, housing, schools, and transport. They show where sleep gets broken, where children learn beside a horn chorus, and where a security guard or street vendor carries the cost of traffic they didn’t create.
If a city can’t show where its noise is landing, it can’t honestly claim to control it.
Key Takeaways
- Noise pollution is a public-health issue linked to disturbed sleep, stress, poorer concentration, and cardiovascular strain, with nighttime exposure especially harmful.
- Effective noise maps should show where sound comes from, who is exposed, and when exposure occurs across roads, homes, schools, hospitals, workplaces, and public spaces.
- A practical noise mapping programme can combine calibrated field measurements, GIS layers, traffic data, noise propagation models, and community reporting.
- India’s noise standards provide useful limits, but mixed-use cities need measurements that reach the places where people actually live, study, rest, and work.
- Mapping matters only when it leads to action, including traffic changes, construction-hour enforcement, road repairs, generator controls, sound barriers, and follow-up measurements.
Noise pollution is a public-health issue, not an urban annoyance
Noise is often dismissed because it doesn’t leave a visible grey film on a window grill. Yet traffic noise monitoring can link prolonged road exposure with disturbed sleep, raised stress responses, poorer concentration, and cardiovascular strain. The health impacts are sharper at night, when the body is meant to recover.
Daytime noise levels above 55 dB(A) matter in residential areas. But 55 dB(A) is not a magic line where health risk suddenly disappears below it. It is a regulatory limit for a land-use category. A family living beside a flyover, an ambulance route, or an active construction site experiences sound repeatedly, not as a single number on a report.
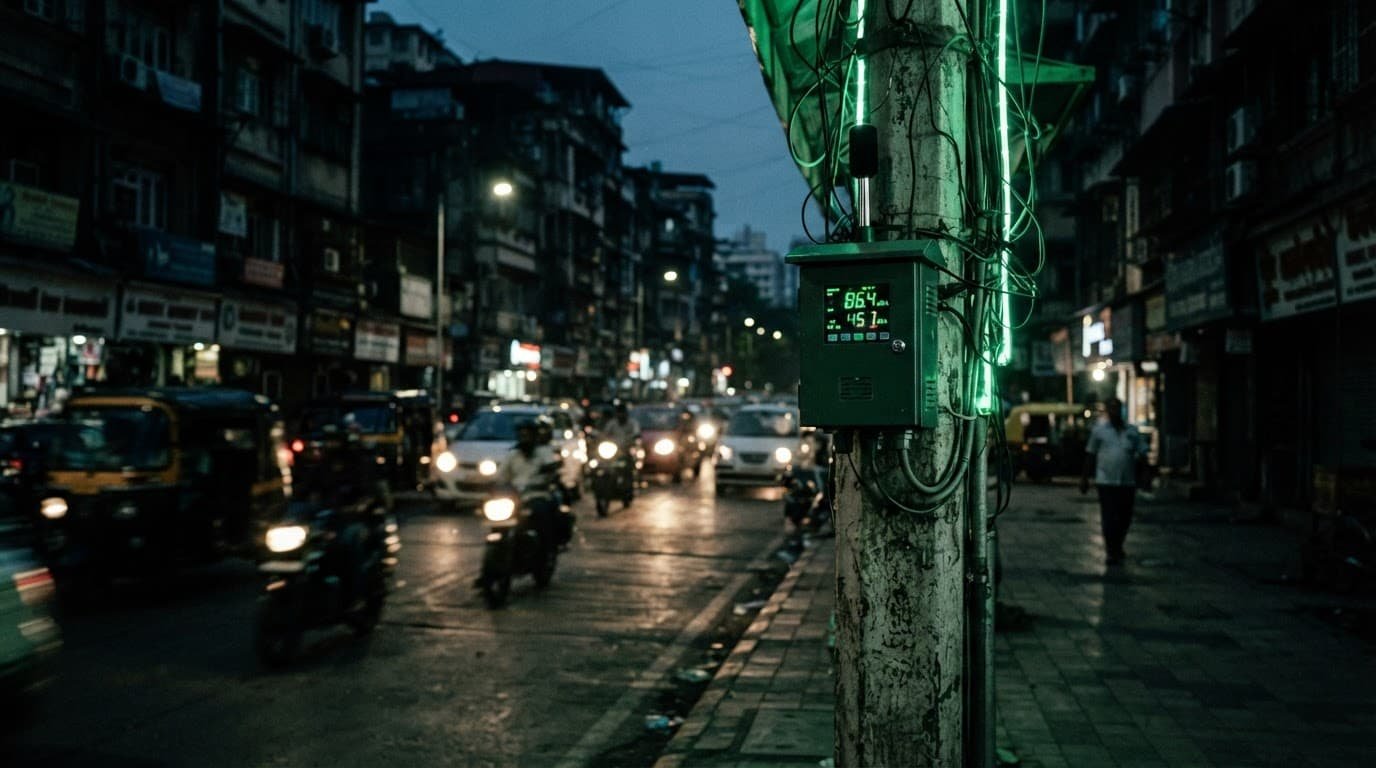
The burden is also unequal, and noise mapping can show who is exposed and when. People with sealed cars, double-glazed windows, and flexible work can escape some of it. Traffic police, delivery riders, vendors, construction workers, patients, and families living near freight corridors often can’t.
Earth5R’s January 2023 noise survey involved 45 volunteers in 15 Indian cities. It found readings in silent and residential locations that were nearly 50 percent above the 50 dB benchmark used for silence zones. That finding isn’t a citywide average. It is a warning about what happens when monitoring misses the places people actually live, wait, study, and sleep.
A citywide average can look acceptable while one school gate or hospital lane takes a daily beating.
What noise maps India needs to show
A noise mapping study turns sound readings into a map of exposure. Environmental noise mapping measures sound from a defined source or area, then uses data analysis to combine readings with GIS layers for roads, building height, land use, traffic flow, rail lines, factories, construction sites, and sensitive locations.
I don’t mean another glossy dashboard with no consequence. Useful noise contour mapping turns readings into exposure bands and identifies the source. It shows whether a junction peaks during rush hour or generators shake a residential lane at 2 a.m.

Field teams place calibrated sound level meters and noise monitoring sensors at selected receptor locations. They log the time, weather, nearby activity, and measurement duration.
The noise mapping workflow geotags those readings and combines them with maps of roads, buildings, and traffic. Traffic noise monitoring adds data from busy roads and junctions.
Noise propagation models estimate how traffic, machinery, sound barriers, terrain, and built density shape sound beyond each monitoring point. Teams validate noise propagation models against field readings and note uncertainty where conditions change.
This process produces coloured contour bands, but the colours are only the beginning. Noise contour mapping should vary by time and source.
It should capture weekday peaks, late-night freight movement, weekend construction, school arrival times, and festival periods. A single daytime snapshot can hide the whole problem.
Comparing noise levels helps planners distinguish rush-hour peaks, nighttime exposure, and baseline conditions. Industrial noise mapping can separate factory activity from nearby traffic and construction.
Different maps answer different questions:
| Map type | Main use | Who needs it most |
|---|---|---|
| Strategic noise mapping | Shows citywide patterns and guides urban planning, transport, zoning, and infrastructure budgets | Urban planners and municipal corporations |
| Environmental noise mapping | Measures a defined source or project, such as a road, factory, rail line, or construction site | Regulators, consultants, and project owners |
| Community noise mapping | Records lived exposure around homes, schools, clinics, markets, and public spaces | Residents, local groups, and ward officials |
Public city maps should not only track decibels. They should show who is exposed, when exposure occurs, and what the responsible authority plans to change. Regular noise mapping should inform urban planning and public decisions.
The rules exist, but measurement must reach the street
India’s Noise Pollution (Regulation and Control) Rules set ambient limits by land use. The CPCB’s published noise standards make the categories clear.
| Area category | Day, 6 a.m. to 10 p.m. | Night, 10 p.m. to 6 a.m. |
|---|---|---|
| Industrial | 75 dB(A) | 70 dB(A) |
| Commercial | 65 dB(A) | 55 dB(A) |
| Residential | 55 dB(A) | 45 dB(A) |
| Silence zone | 50 dB(A) | 40 dB(A) |
Silence zones cover areas within at least 100 metres of hospitals, educational institutions, courts, religious places, and other declared locations. Yet mixed-use Indian cities don’t fit neatly inside lines on a zoning file. A hospital may sit beside a market. A school may face a six-lane road. A residential building may share a wall with a workshop.
Noise mapping creates a baseline for urban planning, permit conditions, inspections, complaint records, and regulatory compliance. Regular traffic noise monitoring can document recurring road exposure. Municipal authorities, environmental agencies, and the CPCB can use those maps to support enforcement, not replace inspections or action.
We have seen this trick with construction dust. A green mesh can look responsible while dry cutting, uncovered rubble, idling trucks, and dirty tyres keep sending pollution into the street. A sound meter placed only at a project’s front gate can become the same kind of compliance prop.
Monitoring has failed when it measures the easiest point, not the place where people are forced to breathe, rest, or work.
Build a practical noise mapping programme, ward by ward
Municipal corporations don’t need to wait for an expensive smart-city tender. The programme can become part of routine urban planning. It needs a clear method, an accountable team, and the willingness to publish uncomfortable results.
A workable programme can begin with five steps:
- Map likely sources first, including traffic junctions, bus depots, rail corridors, industrial edges, construction clusters, diesel generators, and amplified-event venues. This inventory supports industrial noise mapping near factories and construction noise mapping around active sites.
- Place calibrated sound level meters at both source points and receptor points, such as homes, schools, clinics, parks, and roadside work areas. This provides a basis for traffic noise monitoring around roads and junctions.
- Measure at different times. Morning traffic, evening congestion, late-night loading, and weekend activity create different sound patterns, so traffic noise monitoring must cover each period. These readings create a baseline for comparing noise levels before and after later interventions.
- Add the readings to GIS software such as QGIS, with road widths, building footprints, land use, tree cover, and population-sensitive locations. This supports data analysis and noise contour mapping, producing exposure bands for each ward.
- Publish the results, assign hotspots to urban planning teams, set action deadlines for noise mitigation, and remeasure after interventions for regulatory compliance. A map without follow-up is only evidence of neglect.
Paid tools have a place in environmental noise mapping for major road, rail, airport, and industrial projects. CadnaA’s outdoor noise mapping tools and SoundPLAN support computer modeling of complex source, building, and propagation scenarios. CadnaA and SoundPLAN can estimate sound spread and test interventions such as sound barriers. Yet noise propagation models still require reliable field data.
But smaller cities and community groups should not be shut out by licence costs. QGIS, paired with open-source options such as NoiseModelling, can support early-stage urban noise analysis. Open-source software doesn’t remove the need for careful field data. It does remove one convenient excuse for doing nothing.
A map matters only when it changes the street
A hotspot identified through noise mapping should trigger noise mitigation suited to its source. Responses could include rerouting late-night freight, enforcing construction hours, repairing roads, limiting unnecessary honking, or moving generator sets. They might also slow traffic near schools or install sound barriers where they can genuinely protect people.
Trees and green buffers aren’t a substitute for source control, and neither are sound barriers, though barriers can help in suitable locations. Still, all three belong in the plan. A noisy, dust-covered roadside strip is a weak habitat for birds and insects. Protecting urban biodiversity means treating sound, air quality, shade, soil, and water as linked conditions. The ecological impact of constant noise is not separate from the human cost.
Systemic change in urban planning means putting noise limits into road contracts, construction approvals, procurement rules, inspections, and maintenance budgets. Sustainable business models don’t shift noisy loading, drilling, or diesel generation onto the people with the least power to object. A circular economy for construction materials must include controlled demolition and scheduled transport, not midnight rubble handling beside homes.
Plant-based living and everyday mindfulness can make our private choices more aligned with the future we want. But neither makes a 2 a.m. cement mixer quieter. Climate literacy means knowing where personal responsibility ends and public duty begins.
Frequently Asked Questions
What is noise mapping?
Noise mapping turns sound measurements into visual exposure maps. It combines calibrated readings with information about roads, buildings, land use, traffic, and other sources to show where noise occurs and how it changes over time.
Why do Indian cities need noise maps?
Noise maps can show which communities, schools, hospitals, workers, and homes face repeated exposure. They give municipal authorities evidence to guide urban planning, inspections, permits, transport decisions, and noise mitigation.
What should a useful noise map include?
A useful map should identify both the source and the people or places receiving the noise. It should compare daytime, nighttime, rush-hour, weekend, construction, freight, and festival conditions rather than relying on one snapshot.
Are India’s noise standards enough to control noise pollution?
The Noise Pollution (Regulation and Control) Rules set daytime and nighttime limits for industrial, commercial, residential, and silence-zone areas. However, standards only help when authorities measure the right locations, enforce the limits, and respond to recurring hotspots.
What happens after a noise hotspot is identified?
The response should match the source and may include rerouting late-night freight, enforcing construction hours, reducing unnecessary honking, moving generators, repairing roads, or installing suitable sound barriers. Authorities should remeasure the area afterward to check whether the intervention worked.
Conclusion: Make the invisible accountable
Noise doesn’t vanish because a city stops measuring it. Without the noise maps India needs, authorities can keep treating sleeplessness, stress, and disrupted learning as private problems.
Visible exposure patterns need noise contour mapping tied to action, not merely publication.
The hard work is ordinary: calibrated meters, public data, inspections, repair budgets, enforceable conditions, and resident oversight. Municipal authorities and environmental agencies should act on public evidence. Data analysis can show whether an intervention changed a street.
For people ready to connect climate literacy with local accountability and urban biodiversity, Explore Our Active Missions.