India’s Soil Contamination Map Is a Public-Health Need
 TBH Editorial
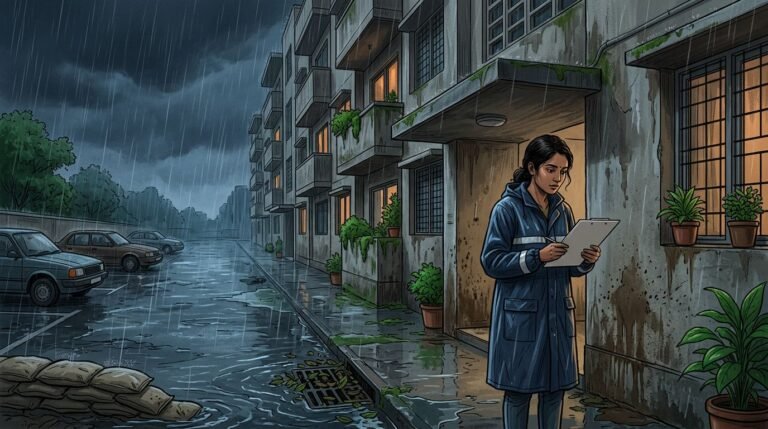
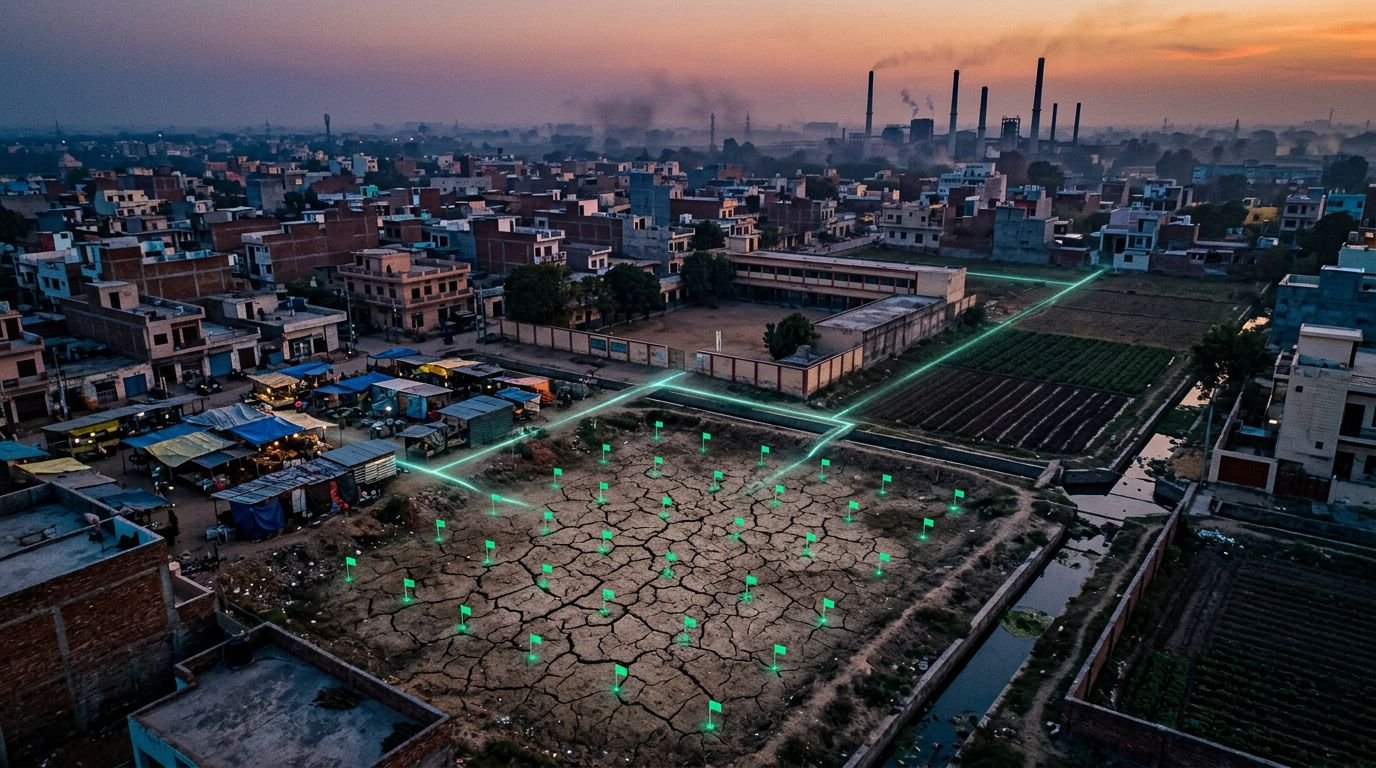
The soil beneath a school, a vegetable farm, or a roadside market can carry a record of what a neighbourhood has burned, dumped, built, and ignored. Yet most of us still treat soil as background scenery, something to notice only when it turns to dust on our shoes.
India needs a soil contamination map India can trust because unmonitored soil pollution doesn’t stay in the ground. It moves through local food, water, road dust, and ecosystems, creating human health risks for people living closest to the source.
We cannot fix exposure that we refuse to measure. The first honest step is to see where the burden of soil contamination sits.
Key Takeaways
- Soil contamination in India comes from industrial discharge, mining, e-waste, sewage sludge, pesticides, construction debris, vehicle emissions, and open burning—and toxic metals can persist for years.
- A trustworthy national soil contamination map should connect verified sampling with pollution sources, exposure sites, ecological systems, soil health, and community reports.
- Mapping must go beyond heavy metals to include agricultural inputs, waste sites, road dust, groundwater recharge areas, and the effects of seasonal changes such as monsoon flooding.
- Public data is useful only when it leads to action, including repeat testing, health guidance, crop restrictions, cleanup, stronger enforcement, and polluter-funded environmental remediation.
- Communities need access to local-language results, complaint channels, Right to Information records, and a meaningful role in challenging missing data and monitoring cleanup.
The Contamination Beneath Our Feet Is Not Random
Soil pollution has many sources, and most are painfully ordinary. Industrial discharge, mining activities, fly ash, sewage sludge, pesticide residues, e-waste handling, damaged roads, construction debris, vehicle emissions, and open burning all leave traces.
Some contaminants break down slowly. Heavy metals and other toxic metals do not. Lead, cadmium, chromium, arsenic, nickel, copper, and mercury can remain in soil for years. Rain can carry them into drains and groundwater, contributing to groundwater contamination. Dry weather can lift contaminated particles back into the air.
That matters in a country where homes, farms, workshops, schools, waste sites, and highways often sit close together.
A child doesn’t need to enter a factory to face the consequences of its waste. They may walk past a dusty truck route twice a day. They may play on an empty plot where debris was dumped. Their family may buy vegetables grown near an industrial corridor.
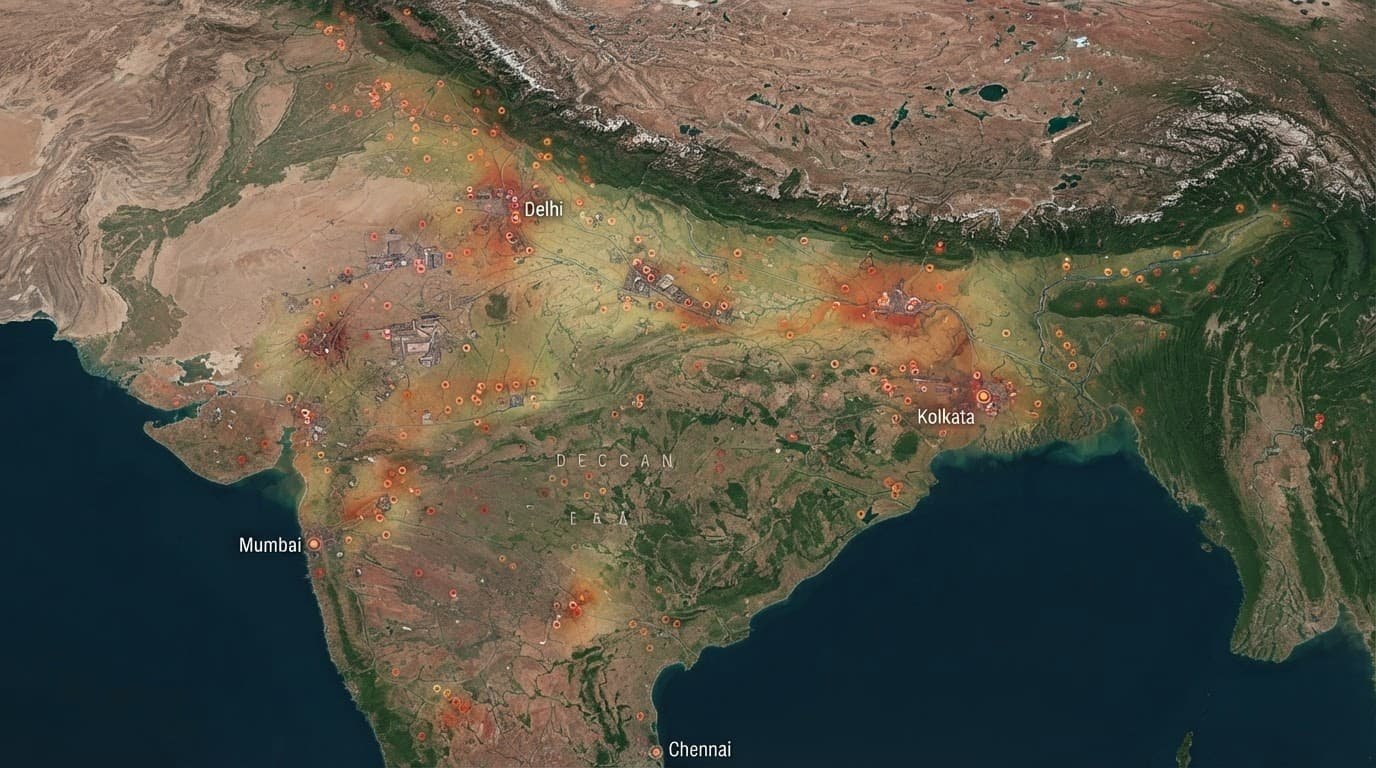
The evidence already exists in fragments. A review of studies across Indian cities found elevated levels of metals such as arsenic, chromium, copper, zinc, nickel, and lead in urban soils. It also identified human health risks from arsenic and chromium, with children facing greater non-cancer risks because of their closer contact with soil and dust.
In Moradabad, the Centre for Science and Environment documented severe heavy-metal contamination around informal e-waste recycling. Soil near the Ramganga river showed zinc and copper levels far above comparison standards. The problem was not a mystery. The policy gap was. India lacked clear heavy-metal soil contamination standards for the situation CSE examined.
A 2024 Kanpur soil contamination study examined nickel, cobalt, manganese, chromium, and cadmium in agricultural soils in a heavily industrialised district. This is the part we must sit with: farmland is not automatically safe because it looks green, and contaminant concentrations can exceed safety limits and agricultural thresholds.
Soil is not a passive dumping ground. It is a living system that can carry industrial decisions into crops, drains, dust, and dinner plates.
The worst harm often stays hidden because soil pollution is not monitored with the urgency given to air. An AQI alert can tell you a city has bad air today. It cannot tell you whether the dust beside a freight corridor contains a toxic metal mix, or whether a school playground sits near contaminated fill material.
That is why a national map must go beyond broad averages. It must show exposure where people actually live.
Why a Soil Contamination Map India Can Trust Matters
A national soil contamination map would not be a glossy dashboard for a ministry launch. It would be public infrastructure, like disease surveillance, flood warnings, or drinking-water testing. Built through coordinated soil mapping and advanced digital soil mapping, it could guide local land use planning and help authorities respond to risks before they become public-health emergencies.
Right now, data is scattered across research papers, state agencies, local laboratory reports, environmental-impact assessments, court filings, and university projects. One district may have a serious study. The next district may have nothing but rumours and a bad smell after rain.
That patchwork protects nobody.
A map would help India answer basic questions that should not be difficult:
- Which farms need repeat testing to protect food safety, prevent wider soil degradation, and ensure crops are safe before entering local markets?
- Which industrial clusters need stronger monitoring and cleanup plans?
- Where are children most likely to encounter contaminated road dust or exposed waste?
- Which water bodies receive runoff from polluted land?
- Which communities have reported harm but never received a proper investigation?
The TERI report on heavy-metal contamination in India called for provisional Indian standards for contaminants in irrigation water, agricultural soil, aquaculture ponds, and agri-produce. That direction is sensible. India needs clear national standards and agricultural thresholds so regulators can judge when contamination threatens crops, water, and public health. You cannot enforce safety when the benchmark itself is missing or unclear.
A map also stops us from treating every place the same. A farming block near a battery-recycling cluster has different risks from a mining belt. An old urban neighbourhood built beside a busy transport corridor has different risks from a remote village near a pesticide-intensive field.
The point is not to stamp areas as permanently damaged. The point is to identify risk early, test properly, reduce exposure, and hold the polluter accountable.
Maps turn vague fear into usable evidence
Communities often know something is wrong before an official file does. Fruit carts gather grey dust each afternoon. Children get repeated coughs. A drain smells chemical after a factory shift. Kitchen gardens stop growing well.
These observations matter. They are not laboratory results, but they tell authorities where to look.
A useful map would connect community reports with verified sampling. It would show where testing happened, what contaminants were found, how old the sample is, and whether any follow-up occurred. It should also name the responsible agency and show what action was taken.
That changes the conversation.
Instead of hearing, “Action has been taken,” a resident could ask: What was tested? On which date? At what depth? Which laboratory analysed it? Did contamination fall after the factory installed controls? Was the waste removed or merely moved?
This is systemic change in plain language. Pollution control becomes a routine public duty, not a press release after outrage.
A National Map Must Track More Than Heavy Metals
Heavy metals deserve urgent attention, but a serious mapping system cannot stop there. Indian soils face several overlapping threats, and each calls for a different response.
A national framework should include these core layers. Traditional soil survey data can be combined with remote sensing and machine learning to predict the spatial distribution of pollutants between sampling points and identify areas that need closer testing:
| Data layer | What it should show | Why people need it |
|---|---|---|
| Heavy metals | Lead, cadmium, arsenic, chromium, mercury, nickel, copper, and zinc | These pollutants can persist and enter food, water, and dust |
| Industrial sources | Factories, power plants, mines, tanneries, recycling zones, and discharge points | Communities can see likely pollution pathways |
| Agricultural inputs | Pesticide residues, fertiliser loading, irrigation-water quality, and sewage sludge use | Farmers need safer choices before soil quality declines |
| Waste and construction | Landfills, dumpsites, e-waste activity, demolition debris, and ash disposal | Exposed waste often reaches nearby soil and drains |
| Soil health | Organic matter, nutrient balance, soil microorganisms, and biological activity | Chemical results alone cannot show whether soil remains productive and resilient |
| Exposure sites | Schools, anganwadis, hospitals, markets, farms, and dense housing | Risk is higher where people spend time close to contamination |
| Ecological systems | Wetlands, floodplains, mangroves, urban forests, and groundwater recharge areas | Polluted soil can damage habitats beyond the original site |
The map should include sampling depth and season. Contamination changes after monsoon flow, flooding, excavation, and dry months. A single soil sample from one day cannot settle a long-term question.
It should also separate background geology from human pollution. Some regions naturally contain higher concentrations of certain minerals. That is not an excuse to ignore risk, but it does affect how results are interpreted.
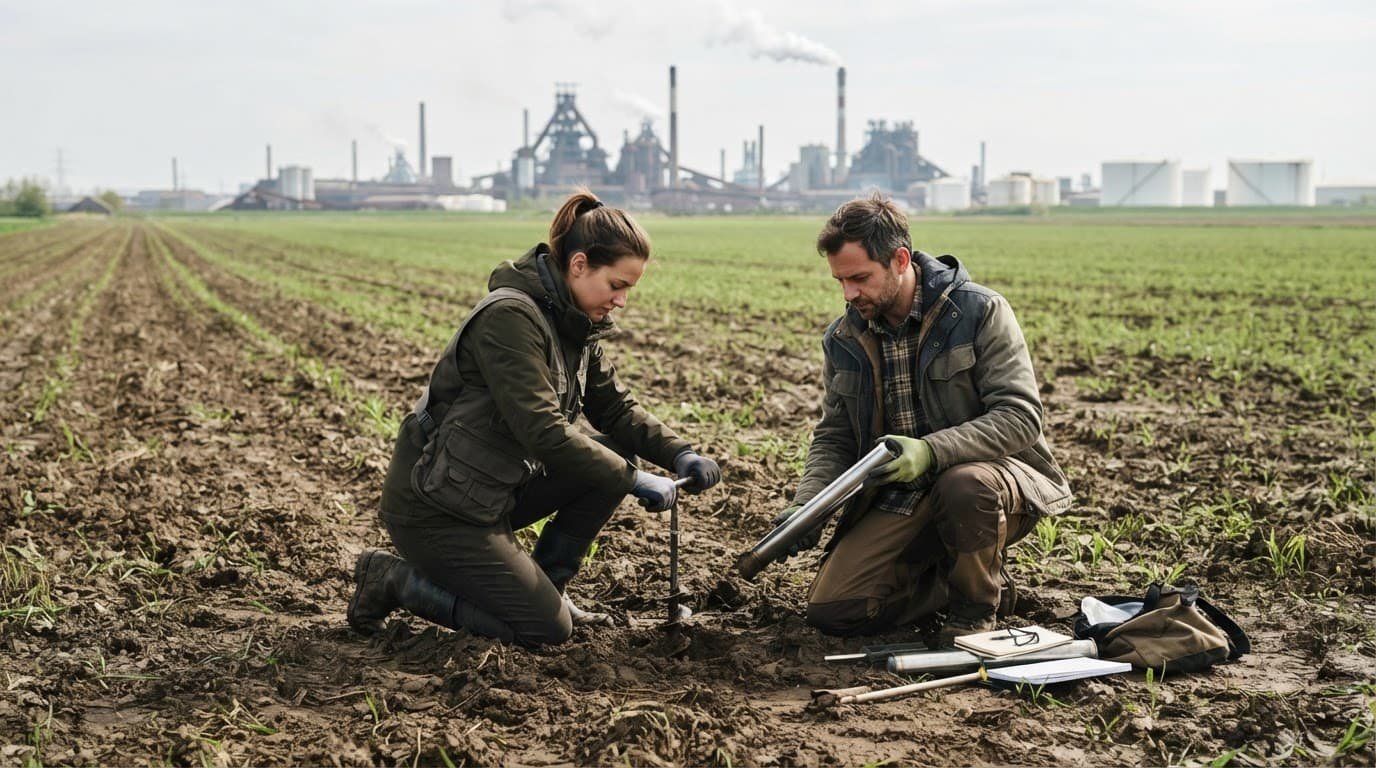
A reliable system would use accredited laboratories, standard methods, repeat sampling, and independent audits. Results should be public by default, with clear explanations in local languages. It should also track when contaminants cross ecological thresholds, because soil systems can deteriorate sharply once these limits are exceeded.
The multi-site heavy-metal contamination dataset shows why environmental sampling needs detail. Levels can differ sharply across soil, water, sediment, and vegetation, even within the same broad area. A map that paints an entire district one colour may look neat. It can also hide the source.
Road dust belongs in the picture
Road dust is often dismissed as dirt. That’s a dangerous shortcut.
Urban dust can contain brake wear, tyre fragments, diesel soot, fly ash, construction material, industrial fallout, and soil dragged onto roads by trucks. Every passing bus, motorcycle, and car can grind that settled material down and lift it back to breathing height.
A clean-looking road in the morning may be dusty again by afternoon because the city keeps feeding loose material into the same corridor.
This is where soil contamination, air pollution, and public health overlap. A child at a school gate, a traffic police officer, a delivery rider, and a fruit seller don’t experience pollution in the same way as someone checking an average city reading from an office.
A national map should flag high-risk roadside zones near industrial areas, construction sites, bus depots, schools, and informal waste clusters. This would make ecological impact visible where it is usually ignored.
The Map Must Lead to Cleanup, Not Just Better Data
Data without a response plan can become another form of neglect. A credible map must trigger environmental remediation wherever soil contamination threatens people, ecosystems, or livelihoods.
Once soil contamination is confirmed, authorities need a public pathway for action. That could mean stopping a discharge, securing a dumpsite, removing contaminated soil, changing irrigation practices, testing food crops, improving road maintenance, or requiring a polluter to fund cleanup.
Not every site needs the same remedy. A contaminated playground may need urgent soil replacement, safe covering, or targeted bioremediation. A farm may need crop restrictions, soil amendments, phytoremediation, cleaner irrigation, and long-term monitoring. An industrial cluster may need waste controls, cleaner production systems, and penalties that exceed the cost of non-compliance.
Long-term protection also depends on systematic soil conservation, including better erosion control, responsible irrigation, organic matter management, and monitoring that tracks whether restored land remains safe.
This is also where the circular economy needs honesty. Recovering materials from electronics, batteries, and construction waste can reduce extraction. But recycling is not ethical when it shifts toxic exposure onto informal workers and nearby residents.
Sustainable business models must account for the full life of a product. That means repairable electronics, formal collection systems, safe recovery facilities, traceable waste movement, and real worker protections. A phone does not become sustainable because a brand launches a take-back campaign while someone else burns its cables in an unventilated lane.
Cleanup costs should follow the polluter-pays principle. Communities should not have to fund testing because a company ignored waste controls.
The public should never have to prove its innocence against a polluted site. The operator must prove that its operations are safe.
Soil Data Is Also a Question of Justice
Pollution is rarely distributed by accident. Low-income communities often live near landfill edges, industrial estates, mining activities, freight roads, drains, and unfinished construction zones, bearing the brunt of severe soil degradation. They may lack formal land titles, political access, or the money to move.
That does not make their health cheaper.
Workers also carry a different burden. Waste pickers, construction labourers, sanitation workers, street vendors, farmers, delivery riders, and traffic police spend more time near contaminated dust and waste. Exposure is shaped by concentration, distance, time, and repetition.
A national map should show these human realities, not only chemical readings.
For example, it should identify contamination near schools, childcare centres, informal settlements, vegetable-growing belts, and public water points, where toxic metals can threaten local food safety. It should also record whether residents were informed, whether local health teams were involved, and whether children received screening when serious risks were found.
This is where climate literacy becomes practical. People need to understand how contaminated soil connects with flooding, heat, food, air quality, and waste. They don’t need a lecture full of technical language. They need usable information about what sits near their homes and what they can demand next.
Protecting soil also protects urban biodiversity. Toxic runoff can harm beneficial soil microorganisms and wetlands. Dust can coat leaves and weaken roadside trees. Contaminated vacant plots become dead zones instead of spaces for insects, birds, native plants, and rainwater absorption.
A city can’t claim green progress while its soil absorbs the cost of everything it consumes.
Communities Need a Clear Way to Act
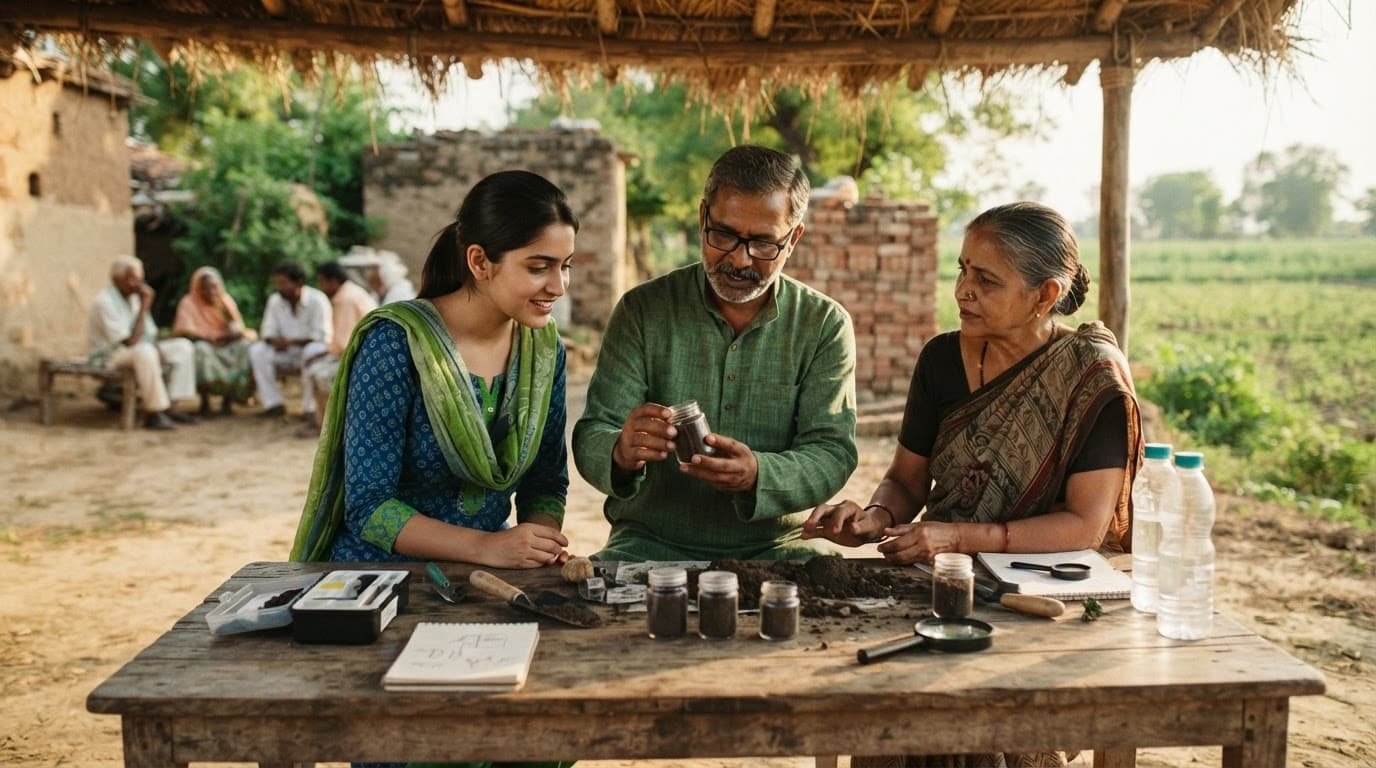
A public map must not leave residents staring at red dots with nowhere to go. Community-led soil mapping can help people monitor localized soil properties, but every flagged site should also link to a clear action pathway.
That pathway should include the local authority responsible, the date of the latest test, the contamination level, health guidance, complaint channels, and the status of cleanup work. It should also show when no testing has happened, so gaps in information are not mistaken for safe soil.
Residents can use the Right to Information Act to ask for existing records. A narrow request works better than a broad complaint. Ask for inspection reports, laboratory results, consent conditions, complaint logs, notices, and action-taken reports for a named site within a defined period.
Do not ask, “Why is the soil polluted?” Ask for copies of soil-test reports from January to June, inspection notes after specific complaints, and notices issued to a named facility.
That is how concern becomes a record.
Personal choices still matter, but they are not a substitute for regulation. Everyday mindfulness can mean avoiding open waste burning, supporting repair over disposal, and asking better questions about local development. Sustainable farming practices, including precision agriculture, can help maintain optimum soil quality, but they cannot remove soil contamination from a schoolyard or chromium from a drain. Plant-based living can reduce pressure from resource-intensive food systems, but it cannot clean polluted land.
We need both personal responsibility and institutional accountability. One without the other is incomplete.
For people who want field action tied to local ecosystems, youth education, and public awareness, Explore Our Active Missions connects community resilience with work that can be seen and verified.
What India Should Build Now
India doesn’t need another pilot that disappears after the launch event. It needs a long-term, publicly funded soil-monitoring programme built on digital soil mapping, systematic soil survey protocols, and predictive machine learning, with clear rules and local accountability.
The work should begin in high-risk areas where severe soil degradation could push pollutants beyond agricultural thresholds and contribute to wider groundwater contamination: industrial clusters, e-waste hubs, mining regions, landfill zones, floodplains receiving industrial runoff, peri-urban farms, old transport corridors, and neighbourhoods beside major construction activity.
The national government can set standards and methods. State Pollution Control Boards can coordinate inspections and enforcement. Municipal bodies can map waste routes, road dust, construction sites, drains, and vulnerable public spaces. Universities and civil-society groups can support independent sampling and public education.
Most importantly, communities must not be treated as spectators.
A map becomes credible when local people can challenge missing data, request retesting, see enforcement records, and follow cleanup funds. That’s what accountability looks like when the contamination is under our feet instead of in a headline.
Frequently Asked Questions
Why does India need a national soil contamination map?
Soil pollution can move into food, groundwater, road dust, and local ecosystems, creating serious public-health risks. A national map would show where contamination is concentrated and help authorities prioritise testing, enforcement, and cleanup.
What contaminants should a soil contamination map track?
The map should include heavy metals such as lead, cadmium, arsenic, chromium, mercury, nickel, copper, and zinc. It should also track pesticide residues, fertiliser loading, sewage sludge, industrial waste, road dust, and other pollution sources.
How can contaminated soil affect children and workers?
Children may be exposed while playing on polluted land, walking beside dusty roads, or attending schools near waste and industrial sites. Workers such as waste pickers, farmers, construction labourers, traffic police, and street vendors may face higher exposure because they spend more time near contaminated dust and materials.
What should happen after contamination is confirmed?
Authorities should identify the source, inform affected communities, restrict unsafe activities where necessary, and begin a site-specific cleanup plan. Measures may include soil removal or covering, safer irrigation, crop testing, bioremediation, waste controls, and long-term monitoring.
How can residents ask for information about polluted soil?
Residents can request existing records under the Right to Information Act, including soil-test reports, inspection notes, complaint logs, notices, and action-taken reports. Requests are more effective when they name a specific site, agency, document type, and time period.
Soil Is Where Environmental Debt Settles
We often speak about pollution as smoke in the sky or plastic in the sea. Soil pollution gets less attention because it holds harm out of sight, but it is where many bad decisions finally settle.
A credible national map would make those decisions visible and guide environmental remediation before contamination spreads through food, water, dust, workplaces, childhood environments, and local ecosystems. That action can also reduce long-term human health risks.
A soil contamination map India can trust is not a luxury database. It is a public promise that no community should have to guess what it is being asked to live on.