
How to Measure Scope 3 Emissions Without a Consultant
 TBH Editorial
TL;DR: You can measure Scope 3 emissions in-house if you stop chasing perfection. Start with the categories most likely to matter, pull data from systems you already use, choose a practical calculation method for each category, and document every assumption. The maths isn’t the hard part. The discipline is.
Most teams don’t need a consultant to start measuring Scope 3 emissions. They need a clean process, decent data, and the nerve to begin before everything looks tidy.
If you’re in sustainability, finance, ops, or running the company yourself, this work can feel bigger than it is. Break it down, and it becomes manageable. Here’s how to do it without turning it into a six-month drama.
Start with what matters, not all 15 categories
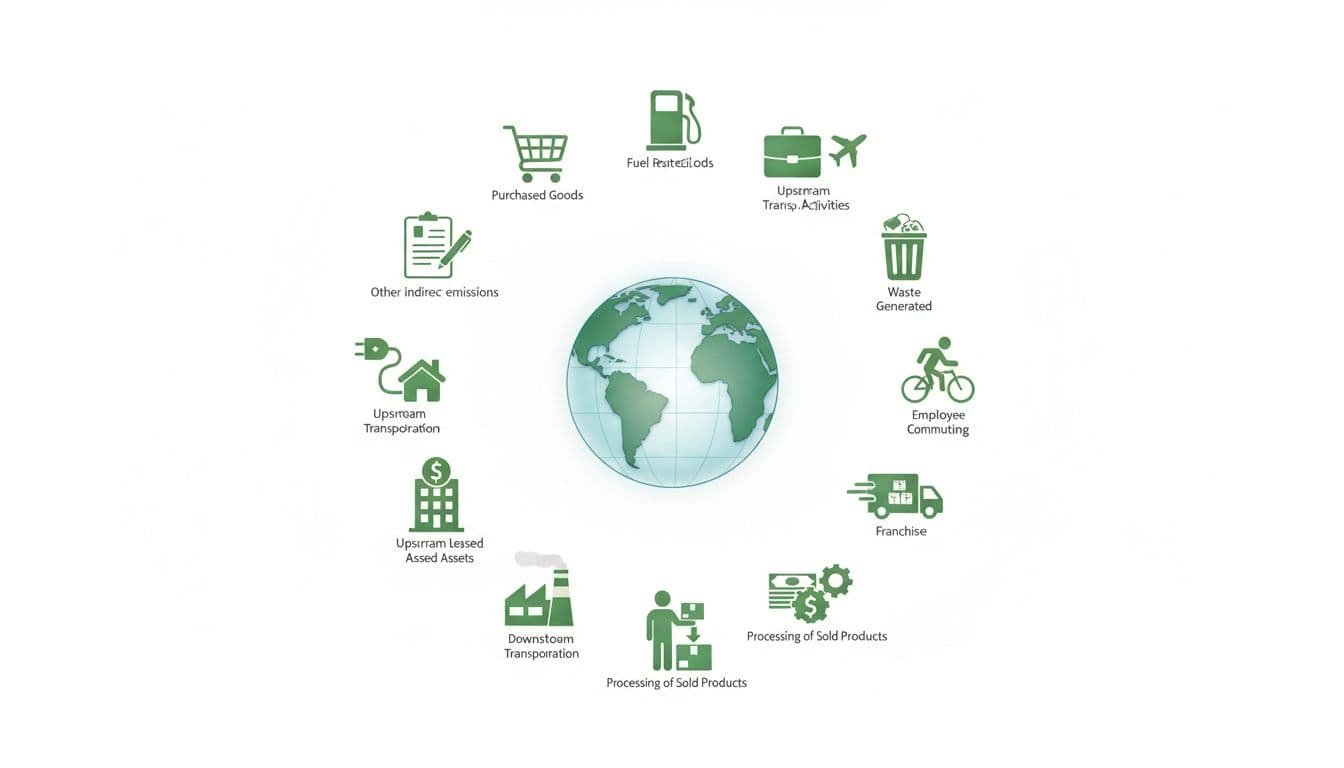
Scope 3 is the stuff outside your own walls, but tied to your business. Think purchased goods, freight, waste, commuting, travel, use of sold products, and end-of-life treatment. It spreads across the value chain, which is why it gets messy fast.
The trick is not to treat all categories as equally important. They aren’t. For most small and mid-sized firms, a handful of categories drive most of the total. Purchased goods and services usually sit near the top. Transport can be large. Business travel can matter in service firms. Waste and commuting often matter less, but not always.
Use the Greenhouse Gas Protocol’s 15 categories as your map. Don’t use them as a punishment.
Start with a quick screening exercise. Ask four blunt questions:
- Where do we spend the most money?
- Where do we move the most stuff?
- Where do customers, investors, or tenders ask for data?
- Which categories can we measure with data we already have?
That gives you a first cut at material categories. For many teams, that means starting with category 1, purchased goods and services, then transport, travel, waste, and maybe commuting or capital goods.
You do not need perfect coverage on day one. You do need a repeatable baseline.
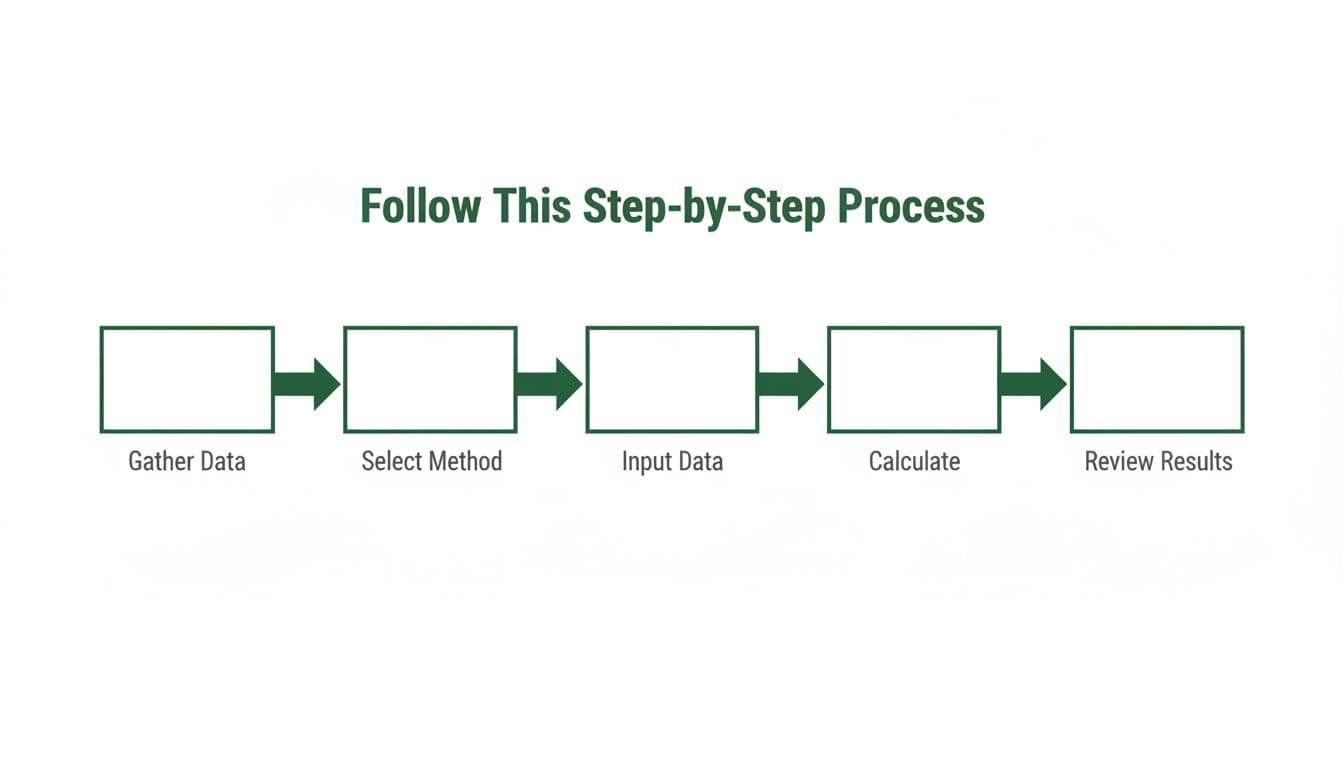
Follow a step-by-step process you can run in-house
A decent Scope 3 process looks more like bookkeeping than black magic. Build it once, then improve it each cycle.
- Map your categories.
Create a simple sheet with all 15 Scope 3 categories. Mark each one as material, not material, or not relevant. Add a note explaining why. That note matters later, when someone asks why a category was excluded. - Assign an owner for each data source.
Finance might own supplier spend. Ops might own freight. HR may hold commuting data. Travel may sit with admin or an external booking platform. One person should coordinate the whole programme, but they shouldn’t chase every invoice alone. - Choose the best method available today.
If you only have money spent, use a spend-based method. If you have quantities, distances, weights, or units, use activity-based data. If a key supplier can give you product-level emissions, use supplier-specific numbers for that supplier. - Apply emission factors and calculate.
For many UK businesses, DEFRA factors are a practical place to start for travel, freight, waste, and fuel-related items. Use the factor that best matches the activity data you hold. Record the source and year of every factor. - Review, sense-check, then freeze the baseline.
If one small category is bigger than purchased goods, something is probably off. Compare your results with your business model. Then lock the methodology for the reporting year, so the baseline doesn’t keep shifting.
Bad Scope 3 reporting usually doesn’t fail because of maths. It fails because nobody wrote down the assumptions.
That single habit, writing down assumptions, saves weeks later.
Use the data you already have before asking for more
Teams often think they have no Scope 3 data. That’s rarely true. They usually have data scattered across five systems and eight people.
Start with the obvious places. Your general ledger and accounts payable file can tell you who you bought from and how much you spent. Purchase orders help sort spend into categories. Freight invoices may include weight, route, or shipment type. Travel receipts show flights, rail, hotels, and taxis. Waste contractors often provide tonnage reports. Payroll or postcode surveys can support commuting estimates.

Don’t ask for primary supplier data too early unless you have strong supplier relationships. If you send a vague spreadsheet to twenty suppliers, half won’t reply, and the other half will send numbers you can’t compare. Start with internal data. Then go deeper on the few suppliers that drive a large share of emissions.
A simple rule helps here: collect data in layers.
First layer, get enough for a baseline.
Second layer, improve the biggest categories.
Third layer, bring suppliers in where it will change the result.
That’s how you avoid drowning in admin while still improving accuracy.
Pick the right calculation method for each category
Not all Scope 3 calculations are built the same. Some are rough estimates. Some are data-rich. Both can be valid if the method matches the data.
This quick comparison keeps the choice honest:
| Method | Best when | Data needed | Effort | Accuracy |
|---|---|---|---|---|
| Spend-based | You only have invoices or ledger data | Spend by supplier or category | Low | Lower |
| Activity-based | You have quantities, distance, weight, nights, or units | Operational activity data | Medium | Better |
| Supplier-specific | A supplier shares product or company emissions data | Verified supplier data | Higher | Often highest |
Spend-based methods are fine for a first pass. They’re blunt, but useful. If finance can export annual spend by supplier and category, you can get moving.
Activity-based methods are better where operational data exists. Freight is a good example. Tonnes, kilometres, and mode of transport will beat spend every time. Business travel also improves fast when you switch from cost data to miles flown, rail journeys, or hotel nights.
Supplier-specific data is worth chasing for large suppliers or carbon-heavy products. Don’t bother collecting it for everything. Focus where it changes the number in a meaningful way.
If you’re stuck between two methods, pick the one you can repeat next year. Fancy methodology with patchy data is a false economy.
Free and low-cost tools are enough at the start
You don’t need shiny software to calculate Scope 3 emissions. A well-built spreadsheet can do more than people admit.
Set up one workbook or shared sheet with five tabs: category map, raw data, emission factors, calculations, and assumptions. Keep version control tight. Lock formulas if several people touch the file. Name the owner. Put dates on everything.
Excel and Google Sheets are enough for many SMBs. Your accounting platform, expense tool, and procurement system will do most of the heavy lifting on raw inputs. The weak spot is usually not software. It’s messy categorisation.
So keep the model boring. Boring scales.
Once the process is stable, then decide whether software would save time. Not before.
Common mistakes that waste weeks
Most mistakes in Scope 3 work are ordinary, not exotic. That should be comforting.
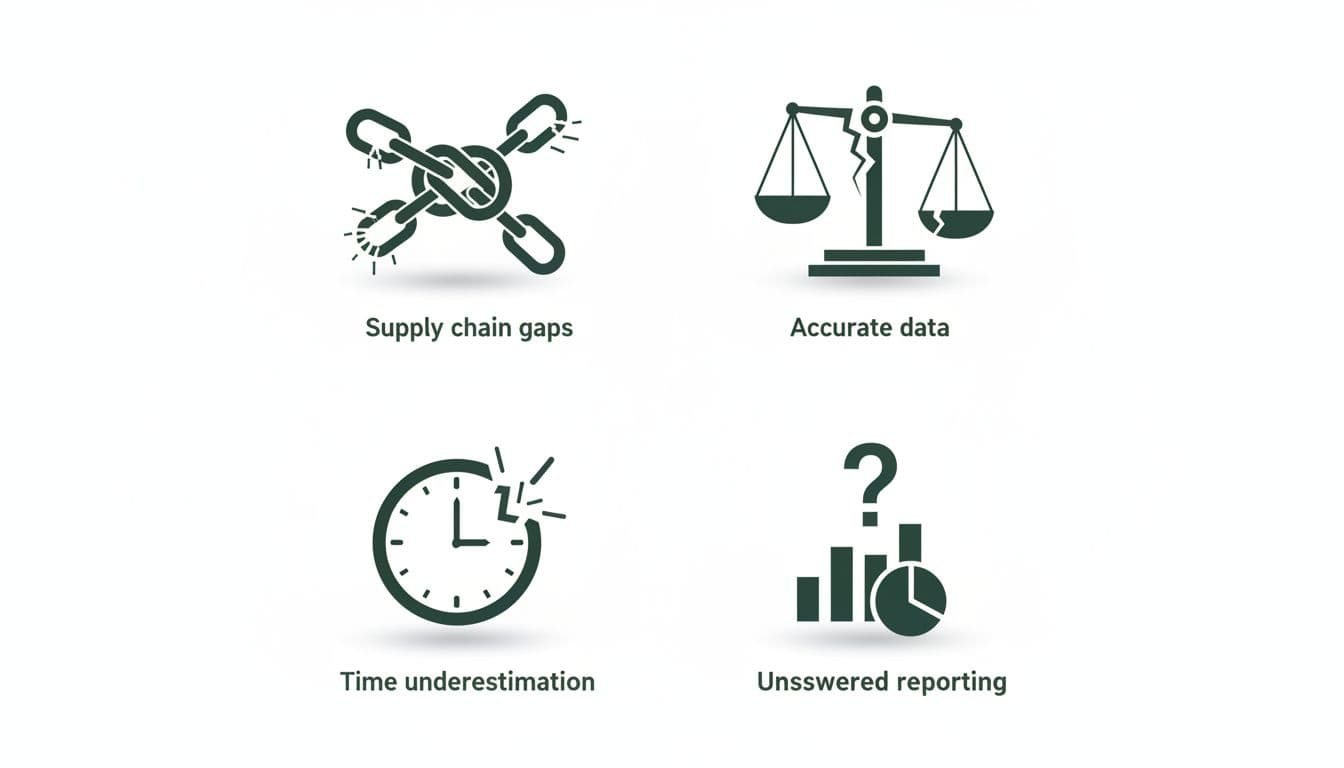
The first mistake is trying to measure every category at full detail in the first cycle. That burns time and patience. Start where the emissions are likely to be largest.
The second is mixing methods without documenting them. If purchased goods are spend-based this year and partly supplier-specific next year, write that down. Otherwise your trend line becomes a guessing game.
Third, teams forget boundaries. Are you measuring all legal entities, one business unit, or only the UK operation? If the boundary moves, say so.
Fourth, people double-count. A courier bill might sit in purchased services and freight if nobody agrees the rule. One category per emission source. No duplicates.
Last, don’t pretend estimates are facts. Say where data is estimated, sampled, or supplied by a third party. That’s not weakness. That’s basic honesty.
A rough, transparent number beats a polished mystery.
Conclusion
You can measure Scope 3 emissions without a consultant if you keep the job plain. Pick the categories that matter, use the data you already hold, choose sensible methods, and document your assumptions like your future self will have to defend them, because they probably will.
Good measurement isn’t about looking clever. It’s about building a baseline you can trust enough to improve.
If you want that work tied to action in the real world, you can also Contribute to Active Missions and support direct field projects such as bird nests and mangrove planting, whilst your own reduction plan takes shape.