How to Calculate a Product Carbon Footprint for One SKU
 Saket Sambhav
Most single-SKU carbon footprints go wrong before anyone opens a spreadsheet. The maths is not the hard bit. The hard bit is deciding what counts, what does not, and how strong your data is.
If you run sustainability, operations, product, or procurement, you do not need more LCA fog. You need a method you can repeat, defend, and improve. That is what turns a product carbon footprint from a one-off report into something useful.
TL;DR
- Fix the exact SKU, functional unit, and system boundary first.
- Use primary data for materials, energy, packaging, and transport wherever you can.
- Calculate emissions stage by stage, then allocate only the share that belongs to that SKU.
- Report the result with assumptions, date, and data quality. A tidy number with messy assumptions is theatre.
Start with the boundary, not the spreadsheet
Before you calculate anything, lock down three decisions: the SKU, the functional unit, and the boundary.
That sounds obvious. It is not. One catalogue item can hide real variation. A bottle made in two plants, with two resin suppliers and two pack formats, may still sit under one SKU in your ERP. Carbon does not care about your catalogue structure.
The functional unit is the thing you are measuring. Usually that is one finished unit, one kilogram, or one litre sold. Use whatever matches how the product is bought and used. If your team says “one SKU”, make sure everyone means the same thing.
Then choose the system boundary. For many supplier requests, cradle-to-gate is enough. That covers raw materials, transport in, manufacturing, packaging, and distribution up to the factory gate or first customer hand-off. If the product’s use phase matters, such as detergents, electronics, or anything energy-hungry, you may need cradle-to-grave instead.
If you need a ruleset, start with the GHG Protocol Product Standard and the ISO 14067 overview. They are not light reading, but they stop you making up the rules halfway through.
A product carbon footprint is not one magic number. It is a model built from choices, data, and assumptions.
Set the time period too. Use a full recent year, or a clearly defined production batch. Do not cherry-pick your best month because the boiler happened to behave itself.
Gather the data that moves the number
Most first-pass footprints are 80 per cent data work and 20 per cent calculation. Start with the inputs that usually dominate: materials, manufacturing energy, packaging, and transport.

Here is the minimum data pack worth chasing:
| Data area | What you need for one SKU | Likely source | | | | | | Materials | Mass of each input, supplier, recycled content if known | BOM, product spec, supplier data | | Manufacturing | Electricity, fuel, yield, scrap, line time | Meter data, plant logs, production records | | Packaging | Weight of primary, secondary, tertiary pack | Packaging spec, procurement | | Transport | Mode, distance, leg, load assumptions | Freight records, 3PL data, ERP | | Use and disposal | Electricity, consumables, disposal route, only if relevant | Product manual, engineering assumptions |
A few practical rules help.
First, use primary data where it changes the answer. If one material makes up half the product mass, get supplier-specific numbers if you can. If a component is tiny and low impact, a decent secondary factor may be enough.
Second, do not wait for perfect supplier data. You will not get it on round one. Use secondary factors to fill gaps, but label them clearly. The IEMA guide on product carbon footprints makes this point well: document data gaps and assumptions openly, then improve them over time.
Third, match units before you calculate. Kilograms, not pieces. kWh, not “about half a day on Line 3”. Litres and kilograms get mixed up all the time. That is how innocent spreadsheets become crime scenes.
If the SKU is made across several sites, decide whether you will calculate site-specific footprints or a production-weighted average. Both can work. The wrong move is quietly blending them with no explanation.
Calculate emissions stage by stage
Once the data is in place, the calculation is simple: activity data x emission factor = emissions. Do that for each life-cycle stage, then sum the results.
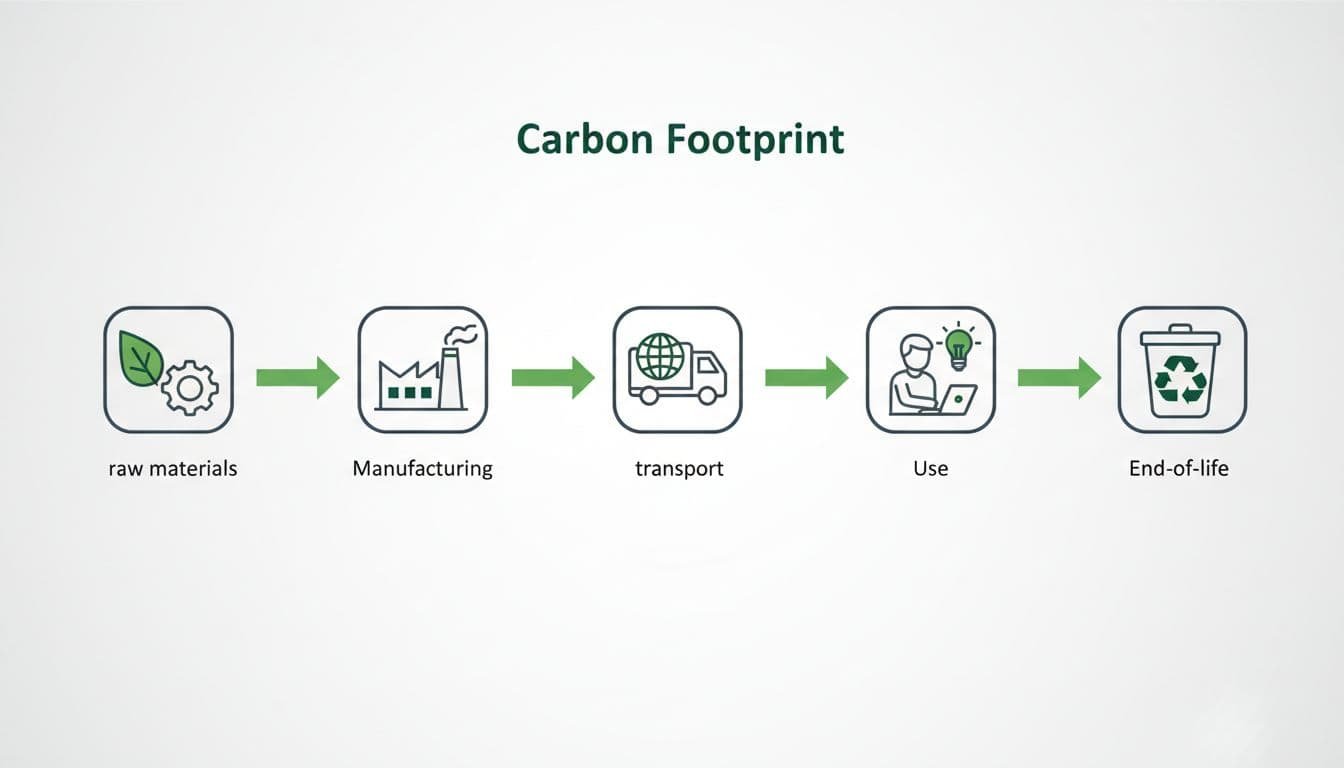
- Calculate raw material emissions first.
Multiply the mass of each input by its emission factor. If your SKU contains 0.2 kg of aluminium, 0.1 kg of plastic, and 0.05 kg of paperboard, calculate each separately. Materials often dominate, so this is where better supplier data pays off fastest. - Add manufacturing emissions.
Take the energy used to make the product, then allocate the right share to one SKU. If a line used 50,000 kWh to produce 100,000 units, that is 0.5 kWh per unit before you apply the electricity factor. Add fuel, compressed air, heat, process losses, and refrigerant leakage if they are material. - Include packaging and scrap.
Packaging is part of the product system, not an afterthought. Count primary and secondary packaging at minimum. Also include scrap and yield loss, because the extra material you buy but do not sell still carries emissions. - Add transport and distribution.
Separate inbound and outbound legs. Use real modes and real distances where possible. Air freight, sea freight, road freight, and courier delivery are not interchangeable, and treating them as if they are will wreck the result. - Include use phase and end-of-life only when they matter.
For many intermediate goods, cradle-to-gate is enough. For products that consume energy, water, or consumables during use, include those impacts. End-of-life can matter too, but only if the product category or customer need calls for it.
Allocation is where people get twitchy, and fair enough. Shared factory energy, shared warehousing, and shared transport loads all need a logic. Use a physical driver where you can, such as mass, machine time, or units produced. If one process creates multiple co-products, use a documented allocation method and stick with it.
The output should be one number in kg CO2e per functional unit. If your functional unit is one finished SKU, say that plainly.
Common mistakes that distort a single-SKU footprint
The most common errors are boring, not exotic. That is bad news, because boring errors slip through.
One classic mistake is double counting transport. A material dataset may already include inbound freight, then someone adds the freight invoice on top. Another is mixing units, litres here, kilograms there, pieces somewhere else, and hoping Excel will be merciful.
Then there is boundary drift. The first meeting says cradle-to-gate. Two weeks later, someone has added customer use phase for one product line, but not the others. At that point, you are not comparing like with like.
The same goes for electricity. If you use a market-based factor for one site and a grid-average factor for another, state it. Better still, avoid mixing methods inside the same study unless you have a solid reason.
Common errors like outdated factors, inconsistent boundaries, and packaging data from an old product version are covered in this practical guide to PCF pitfalls. It is worth a skim before you publish anything.
If the boundary changes halfway through the project, stop and reset it. A faster wrong answer is still wrong.
One more thing: do not pretend precision you do not have. Reporting 31.847 kg CO2e looks scientific. It usually means nobody has thought about uncertainty.
Report the result so someone can trust it
A carbon footprint only becomes useful when another person can understand what sits behind it. That means reporting the number with context, not dropping it into a slide and hoping nobody asks questions.
At minimum, report:
- the footprint in kg CO2e per functional unit
- the boundary, such as cradle-to-gate or cradle-to-grave
- the study period
- the biggest emission hotspots
- major assumptions, exclusions, and data gaps
A good result might read like this in plain English: “6.2 kg CO2e per unit, cradle-to-gate, based on 2025 production-weighted data, excluding customer use phase.” Short. Clear. Hard to misread.
Break the total into stages as well. If 70 per cent sits in raw materials, your next move is supplier engagement or material substitution, not another month arguing over warehouse electricity. That is the whole point of the exercise.
If you need a quicker starting point for suppliers or first-pass estimates, the EcoVadis PCF Calculator is one example of a guided tool. Use tools for speed, not as a substitute for clear scoping and decent data.
Finally, version your footprint. Products change. Suppliers change. Packaging changes. If the study is not dated and version-controlled, it ages badly.
Conclusion
A single-SKU footprint does not need to be glamorous. It needs to be consistent, transparent, and good enough to show where emissions actually sit.
Get the boundary right, gather the few data points that move the number, and calculate stage by stage. That is how a product carbon footprint becomes something your team can act on, not another slide with a suspiciously precise number.
If you want the work to go beyond measurement, pair it with real reduction efforts or direct field action through Contribute to Active Missions.