Measuring Waste Reduction Without Expensive Software
 TBH Editorial
A fancy dashboard won’t fix bad data. A clipboard and a stubborn habit of writing things down will.
That’s good news if you’re trying to cut waste without signing off on another software bill. For most teams, waste reduction measurement starts with a few basic numbers, gathered the same way every time.
TL;DR: You don’t need expensive software to measure waste properly. You need a clear baseline, one simple tracking sheet, and a routine that your team will stick to when things get busy.
Start with a baseline you can trust
If you can’t say where you started, every improvement claim is a guess. Harsh, but true.
Begin with one question: what are you trying to reduce? General waste, food waste, packaging scrap, rejected product, contaminated recycling, all of it? Pick the streams that matter most first. Don’t boil the ocean.
Use the best measure you can manage consistently. Weight is strongest, usually in kg. If you don’t have scales, use a proxy such as bin counts, bag counts, skip collections, or waste-hauler invoices. A rough measure used the same way every week beats a “perfect” measure used twice and forgotten.
The usual low-cost options look like this:
| Method | What you track | Best for | Weak spot |
|---|---|---|---|
| Weighing waste | kg by stream | Sites with scales or floor access | Takes more staff time |
| Counting bins or bags | Number of containers | Offices, retail, small units | Volume can vary |
| Hauler tickets or invoices | Collections and tonnage | Sites with regular pickups | Data may be delayed |
| Manual spot checks | Sampled waste content | Finding problem materials | It’s a snapshot, not the whole picture |
A short walk-through helps before you track anything. Look at where waste appears, where it mixes, and where staff improvise because the system is awkward. The old waste assessment approaches guide still gets the basics right: record reviews, site walk-throughs, and waste sorts are often enough to show where the losses are.
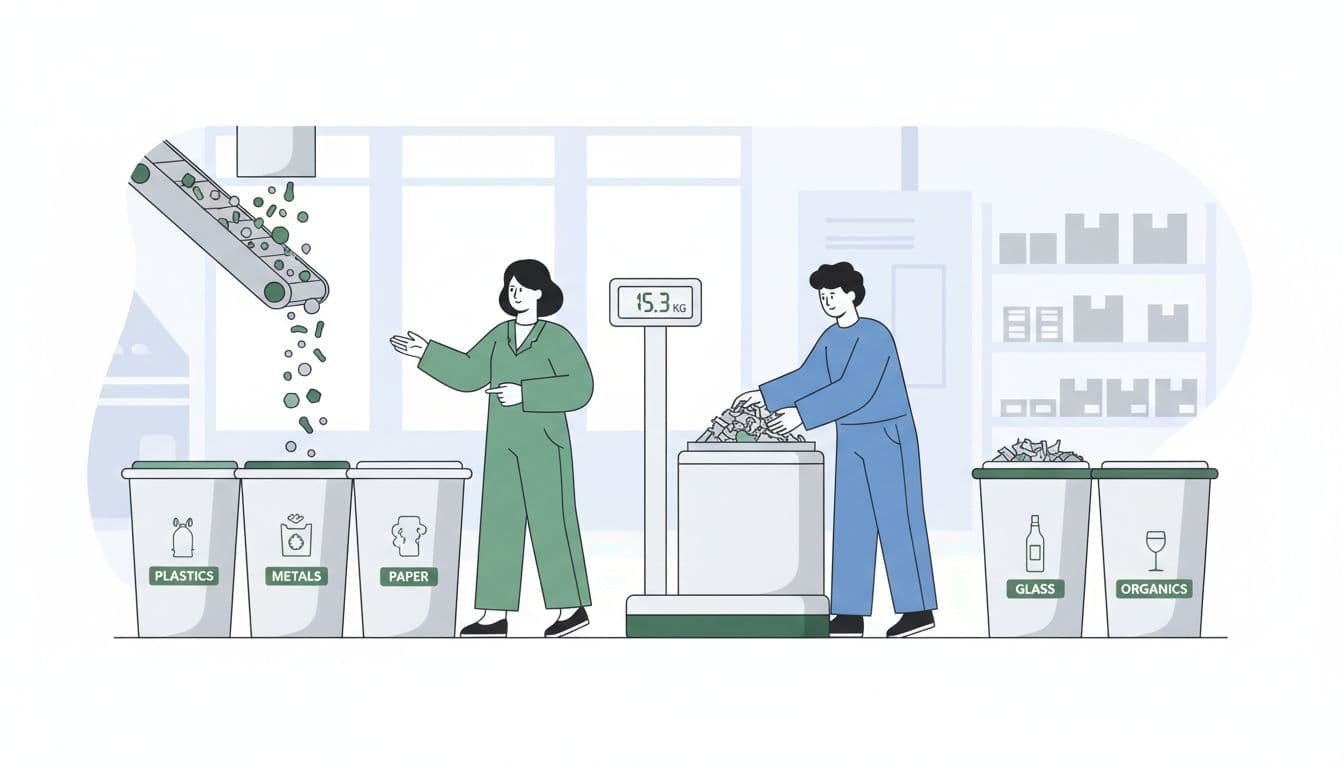
If your waste is mixed or messy, do a simple audit on one representative day. Sort a sample, weigh it, record it, move on. For food operations, WRAP’s waste audit guide and the EPA’s food waste assessment guide both show practical manual methods.
If your method changes every month, your trend line means nothing.
Build a tracking routine people will follow
This is where most waste programmes wobble. Not because the maths is hard, but because the process is annoying.
Keep the tracking sheet simple enough that a tired supervisor can fill it in on a Friday afternoon. A spreadsheet works. Paper works too, if someone transfers it later. The format matters less than the discipline.
Your log only needs a handful of fields:
- Date and area
- Waste stream
- Quantity, in kg or your chosen proxy
- Source or cause
- Action taken, if any
That’s it. No sprawling template. No 17 tabs. No nonsense.
A good routine has four parts. First, decide the frequency. Weekly is usually enough to spot change without creating admin grief. Second, assign one owner per area. Shared ownership often means no ownership. Third, check one secondary source, such as collection notes or invoices, to catch obvious gaps. The EPA’s guidance on measuring progress makes the same point: consistent procedures matter more than fancy tools. Fourth, review the numbers on a fixed day, even if the data isn’t pretty.
One practical rule saves a lot of pain: write down assumptions. If a bag is estimated at 8 kg, note it. If one skip is counted as full, define what “full” means. Six months later, nobody remembers the logic, and then the arguments start.
Small businesses can keep it even leaner. If you’re working from bin collections and supplier packaging records, pair those numbers with a monthly site walk. A simple waste audit checklist for small businesses can keep the review grounded.
The goal isn’t admin theatre. The goal is a number you trust enough to act on.
Look for trends, not perfect precision
Waste data lies when it’s taken out of context. A drop in waste might mean better control. It might also mean lower production, fewer covers served, or a shutdown on line three.
So don’t track waste alone. Track it against activity. Useful ratios include kg of waste per 1,000 units made, per order shipped, per meal served, or per labour hour. That’s when waste reduction measurement becomes useful rather than decorative.
A simple hand-drawn chart is often enough.
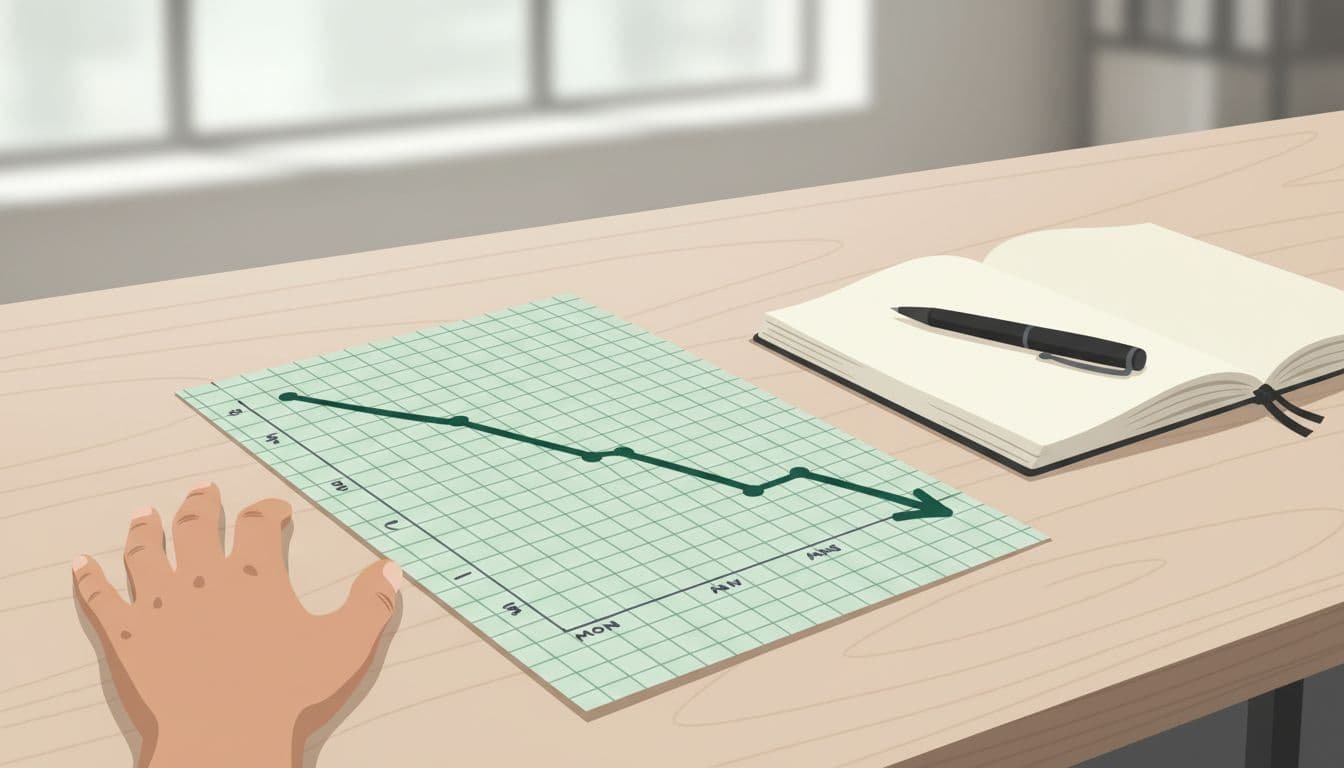
Look for patterns, not drama. Is Monday worse than Thursday? Does one shift contaminate recycling more often? Do reject rates jump after changeovers? Those clues tell you where to fix process, training, storage, or purchasing.
Monthly reviews work well because they slow people down enough to think. Put the chart in front of supervisors and team leads. Ask plain questions. What changed? What stayed stubborn? What needs checking on the floor? If you’re trying to measure prevention, not only disposal, broader methods can help too. The DCCEEW paper on measuring waste prevention outcomes makes a useful point: one metric rarely tells the full story.
Don’t wait for “perfect” data before taking action. If packaging scrap spikes after a supplier change, investigate. If food waste drops after batch-size changes, keep going. Clean trends beat polished reports.
Conclusion
The best waste tracking systems are usually a bit boring. That’s not a flaw. Boring means repeatable, and repeatable means you can trust the result.
Start with one baseline, one sheet, and one review habit. Do that well, and you’ll know whether waste is falling, where it slips, and what to fix next.
If your work on waste ties into broader environmental action, you can also Contribute to Active Missions. The bigger point is simpler: good measurement doesn’t need expensive software, it needs consistency.